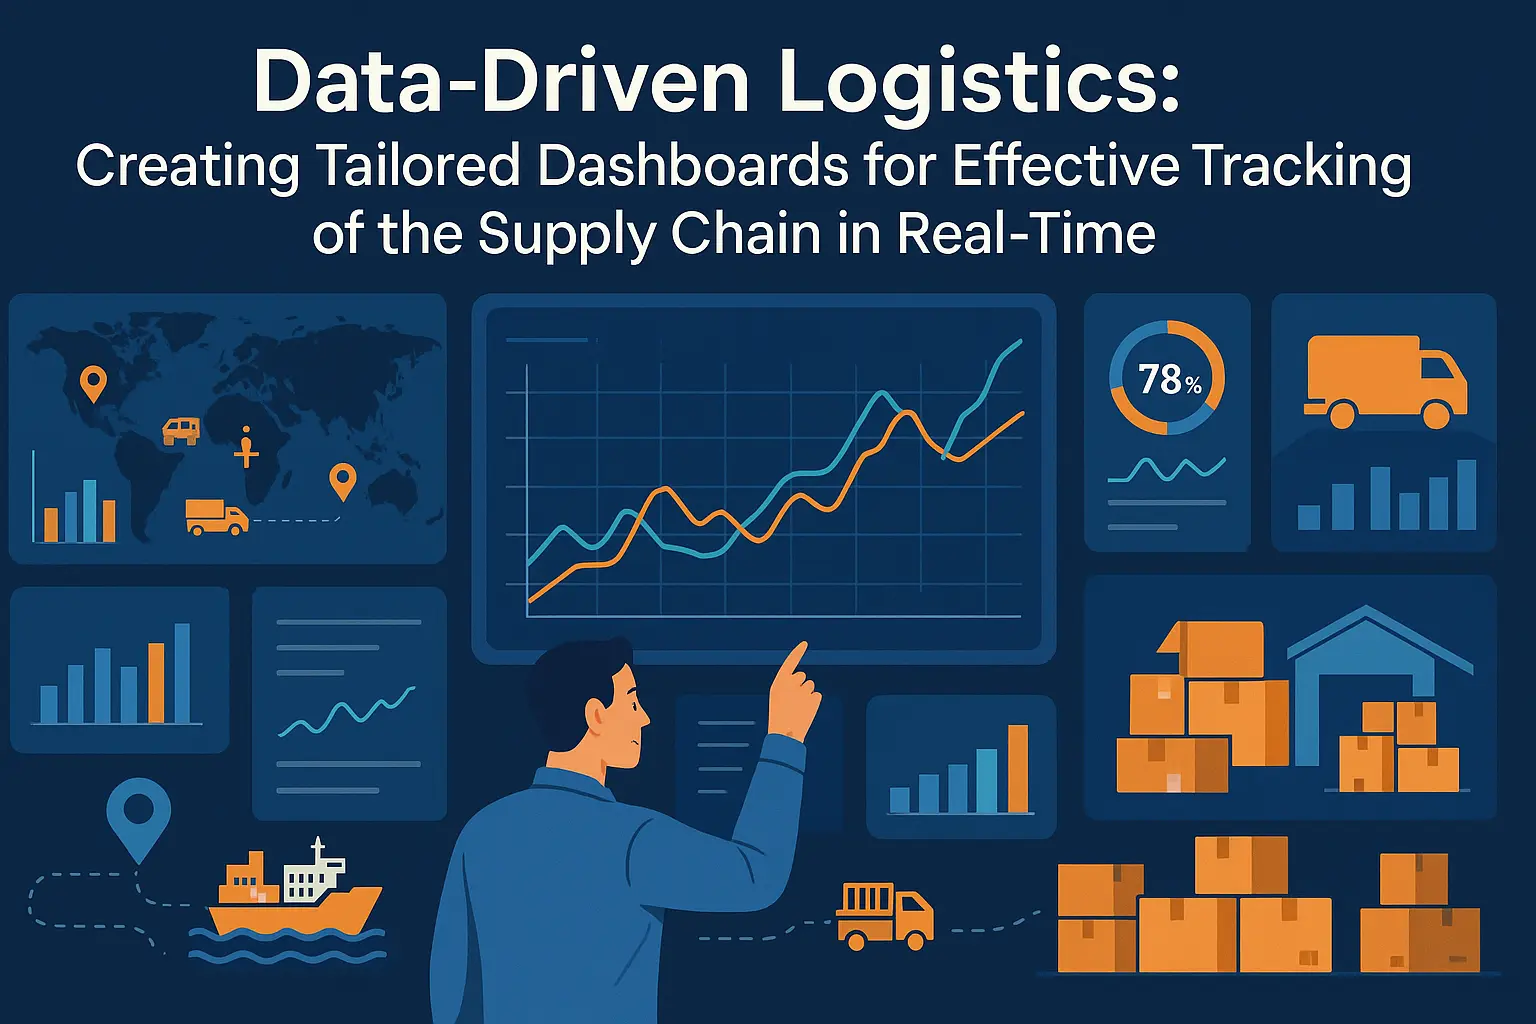
Data-Driven Logistics: Creating Dashboards for Effective Tracking of the Supply Chain in Real-Time

Logistics today is an evolved discipline whereby businesses cannot employ the set-it-and-forget-it strategy. Decisions cannot be made using static reports and outdated spreadsheets. Every delay, a shipment not sent on time, an inventory count that is wrong, or any other similar issue is bound to impact revenue and customer satisfaction. Therefore, achieving supply chain visibility is critical, and the most effective way of attaining it is utilizing custom dashboards set according to a company’s data-driven business needs.
The Evolution of Data Usage in Logistics
In today’s digital environment, logistics create significant data sets. The entire processes of ordering, shipping, inventory management, as well as delivery capture an ever-growing stream of data. Moreover, the growth in data volume and complexity alongside the leap in logistics sensors, bar code scanning, IoT devices, as well as GPS and enterprise software have made logistics data more intricate than ever. However, raw data is of no value unless it is translated into actionable steps by a company.
Real time dashboards illustrate data in a language that supply chain managers comprehend instantly. This illustrates how managers need not spend time understanding intricate datasets and their relationships. Instead, focus on solving supply chain issues. The dashboards monitor key performance indicators (KPIs), track shipments in real-time, and provide alerts to change processes immediately when things go out of course. This grants logistics teams the opportunity to respond rapidly, enhancing operational efficiency by minimizing response time and enabling more uptime.
Custom dashboards addressed off-the-shelf inadequacies as each firm has distinct business needs and requirements. These additive solutions neglect varying degrees of temperature-sensitive items as well as security for electronics. For these reasons, a single predefined structure will not address all necessities.
Custom dashboards solve this problem. Developers build them from the ground up, focusing on what matters most to the business. Each custom button has its own specific purpose such as setting data and alert triggers, defining complex KPIs, tracking efficiency metrics on airborne fleets, inter-branch productivity comparison, or any combination.
Business mandates and operations are now much more flexible through flow and presentation controlled parameters offering dynamic visibility shortcuts. Monitored logics blind zones decrease while overall responsiveness is enhanced. Commanding corporate logistics shifts from presumptions to accurate structured decisions.
Components of a Well Designed Logistics Dashboard
Integrating all relevant information, a powerful logistics dashboard condenses everything in one place. Some features may differ based on the model or structure of the business, but certain elements remain constant.
1. Shipment Tracking
Monitored deliveries through shipment tracking data in real-time enables companies to track route progress along with delivery times and even deviations from the original plan. The current location of every vehicle updates live due to GPS data feeds.
2. Balancing Inventory
Dashboards provide updates whenever inventory crosses pre-defined thresholds while also monitoring stock levels across warehouses with minimum limits. Immediate updates are sent whenever incoming shipments are delayed or inventory is below minimum levels. This streamlines demand forecasting as well as waste reduction.
3. Metrics of Performance Against Predetermined Standards of Warehouse Activities
A vetted warehouse furthers streamlining in the supply chain. Dashboards track metrics such as order picking efficiency, clerical productivity, unloading/loading times, and errors resulting from staff fatigue. Feedback from these KPIs provide insights into process improvement area.
4. Performance Of Carrier And Vendor Retrieved Using Assigned Institute Benchmarks
Carriers and suppliers act as third party vendors for logistics services. An effective dashboard tracks all of the surveyed parameters cumulatively and assesses them independently later by estimating their average trends, calculating delivery windows then averaging the damages to overall reliability ratio along with cost-per-mile. This helps businesses select prospective contractors.
5. Estimating Costs and Forecasting Trends
Custom dashboards monitor logistics expenses such as fuel, labor, maintenance, and storage. They measure forecasted spending against actual spending and recognize future expenses based on patterns. This assists firms in making informed decisions based on sound data analytics.
Technological Components
Logistics dashboards are only effective with the use of certain technologies that work together to gather, process, and visualize real-time data across the entire supply chain.
The Internet of Things (IoT)
IoT sensors collect real-time information on temperatures, humidity, speed, location, and more. Vehicles, pallets, and even storage facilities are monitored and their data is relayed in real-time. This helps dashboards maintain live status reports and also trigger alerts whenever necessary.
Remote Desktop and Cloud Computing
Cloud platforms are able to store and process enormous streams of data while maintaining flexibility, security, and scalability. With remote desktops and cloud computing, businesses can access their dashboards from anywhere and update them through various data sources in real-time.
Artificial intelligence (AI)
AI assists with interpreting vast multi-dimensional data and recognizing intricate, complex patterns within the data. AI facilitates predictive analytics, generating alerts proactively as well as performance forecasting. When integrated with dashboards, AI improves decision making while reducing human error.
Business Intelligence (BI) Softwares
Power BI, Tableau, and Looker are examples of BI tools that enable users and developers to build interactive dashboards and provide analysis. Besides synthesizing raw data into different charts, graphs, and even heat maps, these tools also provide custom reports to suit particular needs. These capabilities enable the logistics teams to interactively visualize the data.
Custom Dashboards and Crisis Management
The smooth functioning of supply chains can be disrupted due to a variety of natural and human-made disasters such as harsh weather or regional political unrest. Real-time dashboards become especially critical in these situations.
In most crisis situations, time is equivocal to dollars lost and dash board updates provide instant information which aids teams in vendor contact, inventory shifts, shipment reroutes and other processes. Work can progress instead of reactive responses because with real time alerts, constraints are actively anticipated, enabling unfettered logistical control while shielding operations.
Improving Decision-Making with Predictive Analytics
Forecasts created based on historical data are referred to as predictive analytics. In logistics it could mean forecasting equipment failures, predicting more timely delivery schedules, or even estimating decreases in inventory. Paired with dashboards, predictive analytics may be a fantastic asset for businesses looking to decrease surprises.
As an example, a dashboard may show a certain route frequently suffers from heavy traffic causing delays. An AI could suggest a different route. Another example is alerts for a particular truck deriving higher than normal fuel usage, indicating potential maintenance concerns.
These insights empower managers to act on more intelligent intel when strategically planning compared to deciding on the present situation alone.
Realistic Uses and Outcomes
Businesses see results after implementing custom dashboards for logistics. One retail company reduced delivery delays by thirty percent with the use of real-time dashboards, GPS tracking, and route optimization tools. Another company was able to cut warehouse errors by fifty percent through real-time monitoring of employee’s accuracy and order fulfillment.
Customer service also sees improvements due to dashboards. Logistics teams can forecast shipment delays and proactively notify customers, thus providing them with options. This level of transparency aids in building brand trust and loyalty.
Constructing Your Personal Dashboard: A Tactician’s Guide
In order to design your own dashboard from scratch, you need to brainstorm and work together. Businesses should focus on what is most urgent first. What recurring problems are there? Which KPIs are most relevant? Which areas are lack of sight known factors?
Once priorities have been determined, strategy sessions with relevant developers is the next step Collaborating with trustworthy logistic software development company is ideal for these scenarios. They specialize in the intricacies of logistics and can create purpose-fit designed dashboards for specific business needs. They know how to integrate underlying frameworks, visualize data appropriately, and adapt advanced dashboards to the organization’s growth.
A well-implemented dashboard pays for itself in efficiency, visibility, and agility.
The Benefits of AI in Logistics
Through real-time dashboards, the advantages of predictive analytics are exceptionally reinforced. The automation of repetitive functions, anomaly detection, and advanced notifying are all possible via AI functions to enable effortless anomaly flagging for late shipments, delivery route optimization, and smarter stocking suggestions. This transforms dashboards from passive data displays to dynamic systems that actively influence decision-making processes.
Enhanced accuracy, reduced delays, decreased operational expenditure all stem from proactive strategies AI with real-time responsive decision processes based on autopilots. Data analytics strengthens the proactive approach without deskulling human wisdom aiming to augment it not replacing entirely.
Conclusion
In today’s world, logistics encompasses more than the simple physical movement of goods within a supply chain; it also includes the transport of information in a timely manner, precision, and synchronized with actual events. Custom dashboards empower logistics teams with perfect control, swift response, and smart planning. Each component of the supply chain is integrated through custom dashboards and displayed in a cohesive interactive format.
With the implementation of data-powered dashboards, businesses gain visibility as well as the capacity to actively respond to changes in a dynamic market


